Zero-Downtime Deployments on Coolify: Measured, Explained, Fixed
 Hasan Aboul Hasan
Published 2026-08-12
Hasan Aboul Hasan
Published 2026-08-12
Coolify's docs say it does rolling updates: start the new container, wait until it is healthy, then stop the old one. My deploys still flashed Traefik's "no available server" page at whoever was on the site. Both things are true, and I got tired of guessing why.
So I put a fresh Coolify on a droplet, pointed a request loop at it from a second machine, and deployed the same app about thirty times. Every config, measured from outside, three deploys each. The short version: a deploy with no health check cost 7.9 seconds of failed requests. The final config reached zero. And the same app deployed through Docker Compose went down for 23 seconds, every single time.
This guide walks that path with the receipts. It is the deployment half of what I teach in Self Hosting 2.0: not "click deploy and hope", but knowing what your proxy is doing and being able to prove it.
Coolify does rolling updates only when four conditions hold: a passing health
check, default container names, no host port mapping, and not a
Docker Compose deployment. Without a health check it still rolls, but blind, and your boot
time becomes your downtime. A naive HEALTHCHECK makes it worse in a sneaky way:
the deploy fails and your new code never ships. The full fix is a health check with a tuned
start-period, plus a Traefik retry middleware and a 1-second
dialTimeout for the last 0.2 seconds. Measured result: zero failed requests at
10 requests per second.
- Deploys that pass a measured zero-failed-requests test, not a "seems fine" refresh
- A health check that actually gates traffic instead of failing your deployments
- The two Traefik settings that close the final 0.2-second gap, and where each one goes
- A 40-line probe script to measure your own deploys, plus the test app repo to practice on
- An honest answer about Docker Compose, with the 23-second number to back it up
- What you need: a Coolify v4 server and an app deployed from a Dockerfile or image. Compose apps cannot get rolling updates at all; the compose section covers your options.
- Tested on: Coolify 4.1.2 with its bundled Traefik v3.6.25, Ubuntu 24.04, a default 2 vCPU / 4 GB DigitalOcean droplet, real domain and Let's Encrypt certificates.
- The numbers: every number on this page comes from a probe hitting the live domain 10 times per second from a separate machine, three deploys per config. Your app's boot time will move the numbers; it will not change the mechanics.
Why you see "no available server" when you deploy
This is the page your visitors get. Not a styled error, not a maintenance screen. Three lowercase words on white:

no available
    server
. This exact response came back 628 times during three Docker Compose
deploys.The words come from Traefik, the reverse proxy Coolify puts in front of everything. Traefik keeps a list of containers it can send your domain's traffic to. When that list has zero healthy entries, it answers 503 with this body. During a deploy there is a window where the old container is gone and the new one is not ready. If Traefik's list is empty in that window, your visitors read those three words.
If you came here from Google with this exact error and it is not tied to deploys, the official troubleshooting page covers the other causes: wrong domain, wrong exposed port, a failing health check in steady state. And if your error says "server is not reachable" instead, that is a different problem on a different layer. That one is Coolify's panel failing to SSH into your machine, and I broke a server five ways to document it in its own guide.
One more thing you will see in the receipts below: not every deploy gap shows this 503. A
plain Dockerfile deploy gap usually shows 502 Bad Gateway instead. The difference
matters for diagnosis, and the FAQ pins it down. Short version: 502 means
Traefik still has your container on its list but cannot connect to it. 503 "no available server"
means the list is empty.
How I measured it: a probe from outside
You cannot see this window from the server itself. A docker ps on the box shows
containers "running" while your visitors get errors, because the question is not "is the
container up", it is "does a request from the internet come back with a 200". So the probe runs
on a separate machine and asks exactly that, 10 times per second:
while True:
    t0 = time.time()
    try:
        with urllib.request.urlopen(URL, timeout=2.0) as r:
            status, body = str(r.status), r.read(4096)
    except urllib.error.HTTPError as e:
        status, body = str(e.code), e.read(4096)   # 502/503 land here
    except Exception as e:
        status, body = type(e).__name__, b""       # timeouts, refused
    log(f"{utc_ms()} {status} {(time.time()-t0)*1000:.1f} {snippet(body)}")
    sleep_until_next_tick(0.1)
Every request becomes one log line: timestamp, status, latency, and the first 80 characters of the body. The body matters. It is how you tell a 503 from Traefik ("no available server") apart from a 503 your own app might return, and it is how you catch which container version answered. The full script is in the test repo, stdlib only, no dependencies.
The app under test is deliberately tiny, with one honest trick: a
STARTUP_DELAY_S variable that makes it bind its port only after 15 seconds.
A hello-world container boots in milliseconds and hides the whole problem. Real apps run
migrations, warm caches, import half of npm. 15 seconds is a fair stand-in for the Django,
Rails and Spring apps people actually deploy. Deploy counts, timestamps and full probe logs for
every run in this guide are committed alongside the app.
Baseline: no health check, 7.9 seconds down
First deploys, no HEALTHCHECK anywhere. This is what most people's first Coolify
app looks like, because nothing forces you to add one. Three deploys, measured:
7.7, 7.9, 8.1 seconds of failed requests. 77 to 81 failed requests per deploy
at 10 per second. Median 7.9.
Here is the part that surprised me. I expected Coolify to fall back to stop-then-start
without a health check. It does not. The deployment log still says "Rolling update
started", and the order of operations is still new-first. What is missing is the waiting.
Watch the timeline, reconstructed from docker events on the server and the probe
log from outside, for one deploy:
Deploy with no health check, second by second
docker events on the server, probe results from outside. t+0 is the moment the deploy started.
- t+14.5sNew container created and started. It now begins its 15-second boot. Traefik sees a second container for the domain and starts sending it requests immediately.
- t+15.5sCoolify tells the old container to stop (
docker stop, SIGTERM). - t+15.8sErrors begin. Traefik now load-balances between a container that cannot answer yet and one that was told to die.
- t+15.8–30.9sEvery second request fails with 502 Bad Gateway for 15 seconds. 200, 502, 200, 502, at exact alternation.
- t+30.9sThe new container finally binds its port. Errors stop.
- t+45.5sThe old container is force-killed, 30 seconds after SIGTERM. One last request times out during the removal.
Your boot time is your downtime. Coolify starts routing to the new container the moment it exists, not the moment it is ready. My 15-second boot produced a 15-second window of 50% errors, which sums to the 7.9 seconds the probe counted.
The alternation is the probe log's most honest picture of what "no health check" means:
20:56:35.290Z 200 23.3  zdd-testapp v1 pid=1 started=20:53:38Z   ← old container
20:56:35.390Z 502 46.0  Bad Gateway                              ← new one, still booting
20:56:35.490Z 200 23.2  zdd-testapp v1 pid=1 started=20:53:38Z
20:56:35.590Z 502 32.1  Bad Gateway
20:56:35.690Z 200 19.6  zdd-testapp v1 pid=1 started=20:53:38Z
20:56:35.790Z 502 28.7  Bad Gateway
...continues like this for 15 seconds: 77 failed requests this deploy
One footnote from the timeline that will matter to you if your app shuts down cleanly: my test app survived those 30 extra seconds because Python running as PID 1 ignores SIGTERM by default, so the old container kept answering until the force-kill. An app that exits promptly on SIGTERM, which is most well-behaved Node and gunicorn setups, loses the old container at t+15.5 instead. Then the window is not 50% errors. It is 100%.
The four conditions Coolify actually requires
The rolling updates doc lists the conditions for the real thing, the version that waits. All four have to hold. In my testing each one earned its place:
- A health check, configured and passing. This is the readiness signal. Without it Coolify has nothing to wait for, and you get the blind roll you just saw.
- Default container naming. A custom container name means the new and old container would need the same name, which Docker does not allow. Rolling updates need both alive at once.
- No host port mapping. Same collision, different resource. If the old container holds port 3000 on the host, the new one cannot bind it while the old one runs. Let Traefik do the routing and expose nothing.
- Not a Docker Compose deployment. Compose resources are stopped, then recreated. Measured cost below: 23 seconds.
The first condition is where the work is, so the next two steps are about getting a health check that is both correct and trusted.
Step 1: add a HEALTHCHECK (and meet the trap)
The obvious move: add a health check to the Dockerfile so Coolify can tell ready from not
ready. The equally obvious first attempt, with default timings. One line in it is not optional:
python:3.12-slim ships without curl, and a health check that calls a missing curl
fails forever, so the apt-get line stays:
FROM python:3.12-slim
RUN apt-get update && apt-get install -y curl && rm -rf /var/lib/apt/lists/*
WORKDIR /app
COPY app.py .
EXPOSE 3000
HEALTHCHECK --interval=5s --timeout=3s --retries=3 \
  CMD curl -f http://127.0.0.1:3000/health || exit 1
CMD ["python", "app.py"]
I deployed this three times. Downtime: zero. Success? No. All three deployments failed. The new code never went live. Here is Coolify's own log:
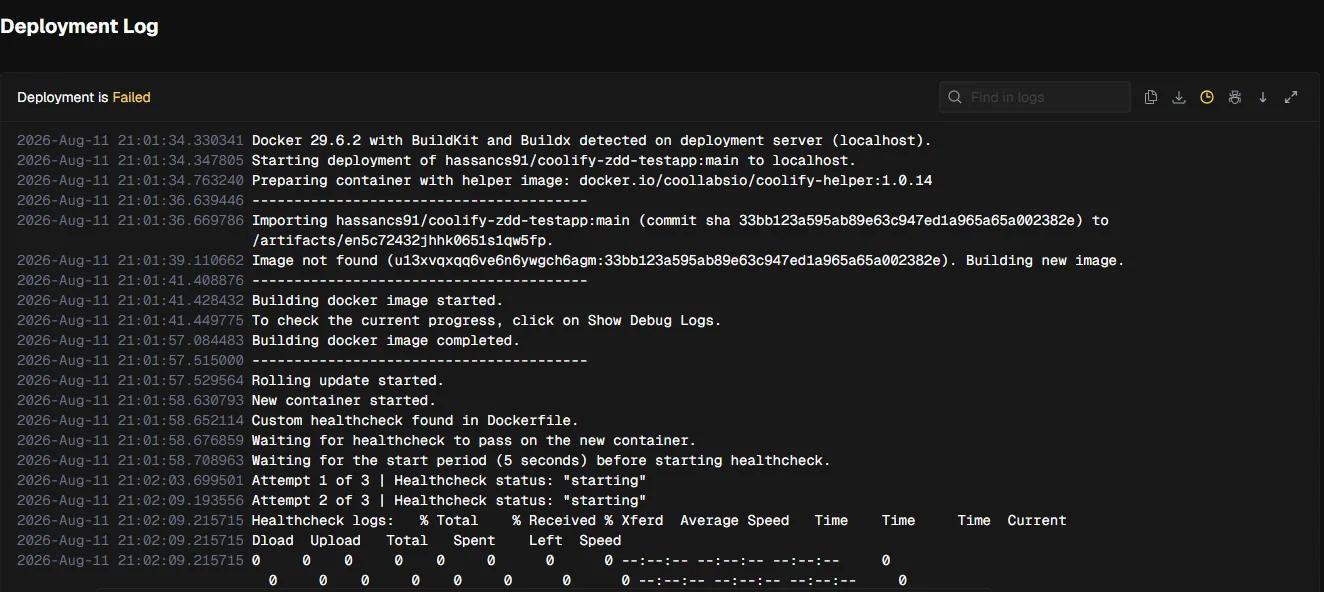
The log's last lines spell out what happened next, and they are worth reading slowly:
Attempt 1 of 3 | Healthcheck status: "starting"
Attempt 2 of 3 | Healthcheck status: "starting"
Attempt 3 of 3 | Healthcheck status: "unhealthy"
New container is unhealthy.
Removing old containers.
New container is not healthy, rolling back to the old container.
Rolling update completed.
Do the math and it is obvious. The app needs 15 seconds to boot. The health check fires every 5 seconds and gives up after 3 tries. Three failures land before the app ever binds its port, Docker stamps the container unhealthy, and Coolify does the safe thing: keeps the old container serving and throws the new one away.
I want to be fair to Coolify here: this is the correct default behavior. Rolling back beats serving a dead container. But it produces the most confusing failure mode in this whole guide, because your site stays up while your deploys quietly stop working. If you have ever added a health check "for safety" and then noticed your changes were not live, this was probably why.
Step 2: tune start-period so deploys succeed
Docker's answer to the slow-boot problem is
--start-period: a grace window in
which failed checks do not count. Set it longer than your worst real boot, and keep the interval
short so readiness is detected quickly once the app is up:
HEALTHCHECK --interval=2s --timeout=3s --retries=3 --start-period=20s \
  CMD curl -f http://127.0.0.1:3000/health || exit 1
My app boots in 15 seconds, so 20 gives it headroom. Measure yours: docker logs
timestamps from container start to "listening" is enough. When Coolify finds a
HEALTHCHECK in the Dockerfile it uses it, and the deployment log confirms with
"Custom healthcheck found in Dockerfile". You can see what Coolify picked up in the
application's Healthcheck tab:
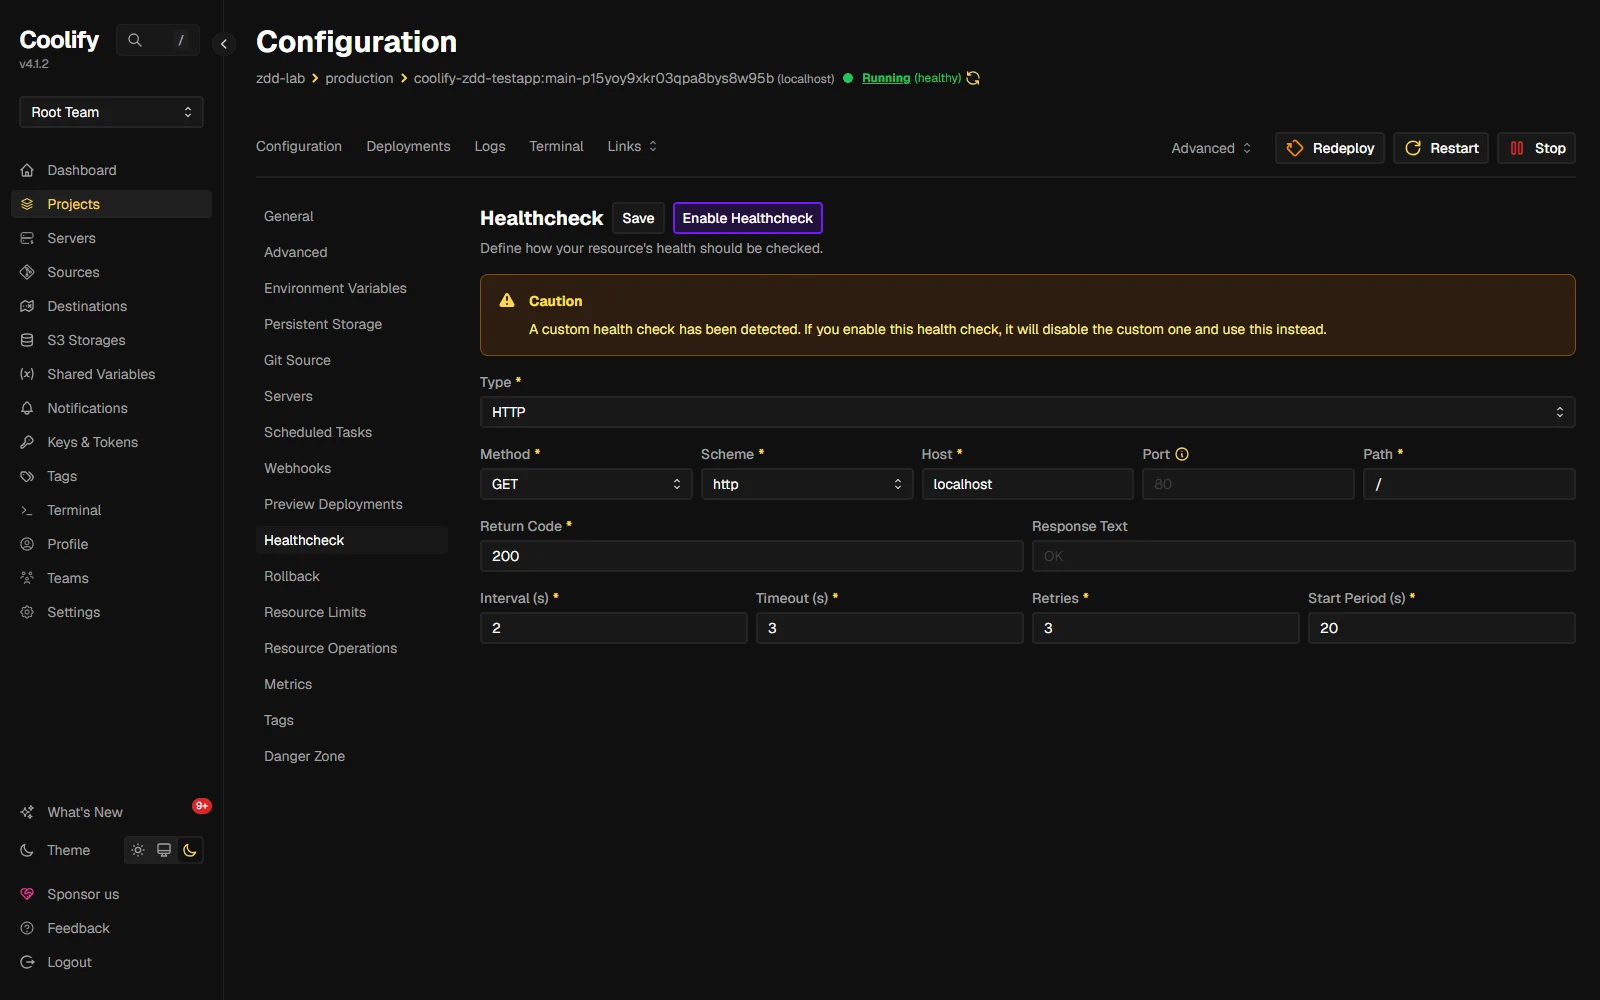
Three deploys with the tuned check: 0.2, 0.2, 0.1 seconds. One or two failed requests per deploy, down from about 80. The timeline is now what the docs promise: new container starts, health checks run through the boot, container flips to healthy at around t+34, and only then does Coolify stop the old one.
Rolling update started.
New container started.
Custom healthcheck found in Dockerfile.
Waiting for healthcheck to pass on the new container.
Waiting for the start period (20 seconds) before starting healthcheck.
Attempt 1 of 3 | Healthcheck status: "starting"
Attempt 2 of 3 | Healthcheck status: "healthy"
Removing old containers.
Rolling update completed.
For a lot of apps, stopping here is fine. 0.2 seconds at 10 requests per second is one or two unlucky requests per deploy. But "one or two unlucky requests" is not zero, and I wanted to know what was left.
Step 3: the last 0.2 seconds are Traefik's
The residual blip has a precise signature in the probe log: right at the moment the old
container is removed, one request gets a 502 and one hangs until the probe's
timeout. Always at that moment, never another.
My first suspect was in-flight requests dying with the old container, so I taught the app to drain: catch SIGTERM, finish open requests, then exit. Good practice, made the old container exit in 1 second instead of being force-killed after 30. And it changed the failed-request count not at all. Three more deploys: 0.2, 0.2, 0.1. Same signature.
Because the problem is not in the app. Traefik reads its routing table from Docker events, and there is a beat, well under a second, between "old container exited" and "Traefik stopped routing to it". Requests that land inside that beat get sent to a container that no longer exists. No app code can fix a proxy routing to a corpse. The fix has to be on the proxy, and it comes in two Traefik-native parts.
Part 1: a retry middleware, in the app's labels
Traefik can retry a request that failed to connect, transparently, against the next server on its list. Failed connections are exactly our failure mode. In the application's Advanced → Container Labels in Coolify, add a middleware and attach it to the HTTPS router (the router name is already there in the generated labels):
traefik.http.middlewares.zdd-retry.retry.attempts=3
traefik.http.middlewares.zdd-retry.retry.initialinterval=100ms
traefik.http.routers.https-0-<your-app-uuid>.middlewares=gzip,zdd-retry
Keep gzip in the list: Coolify put it there, and replacing the line means
replacing, not appending. Measured effect, three deploys: the 502s are gone. What remained was
exactly one hung request per deploy, the one that dials the dead container and waits.
Part 2: a dial timeout, in the proxy's dynamic config
That hung request is Traefik dialing a container that will never answer, with a default dial timeout of 30 seconds. The retry middleware cannot help until the dial gives up, and 30 seconds is longer than any visitor will wait. So cap it: tell Traefik to give up dialing after 1 second, after which the retry hits the healthy new container.
Here is the part that cost me an outage to learn, so read it before pasting: on the Traefik
v3 that ships with current Coolify, a serversTransport cannot be defined in
container labels. I tried. Traefik logged "servers transport not found",
dropped the whole service, and served, with no irony at all, no available server
on a perfectly healthy app. It has to live in the file provider, and Coolify has a first-class
place for that: Servers → Proxy → Dynamic Configurations → Add. Name the file
zdd-transport.yaml and paste:
http:
  serversTransports:
    zdd-fast:
      forwardingTimeouts:
        dialTimeout: "1s"
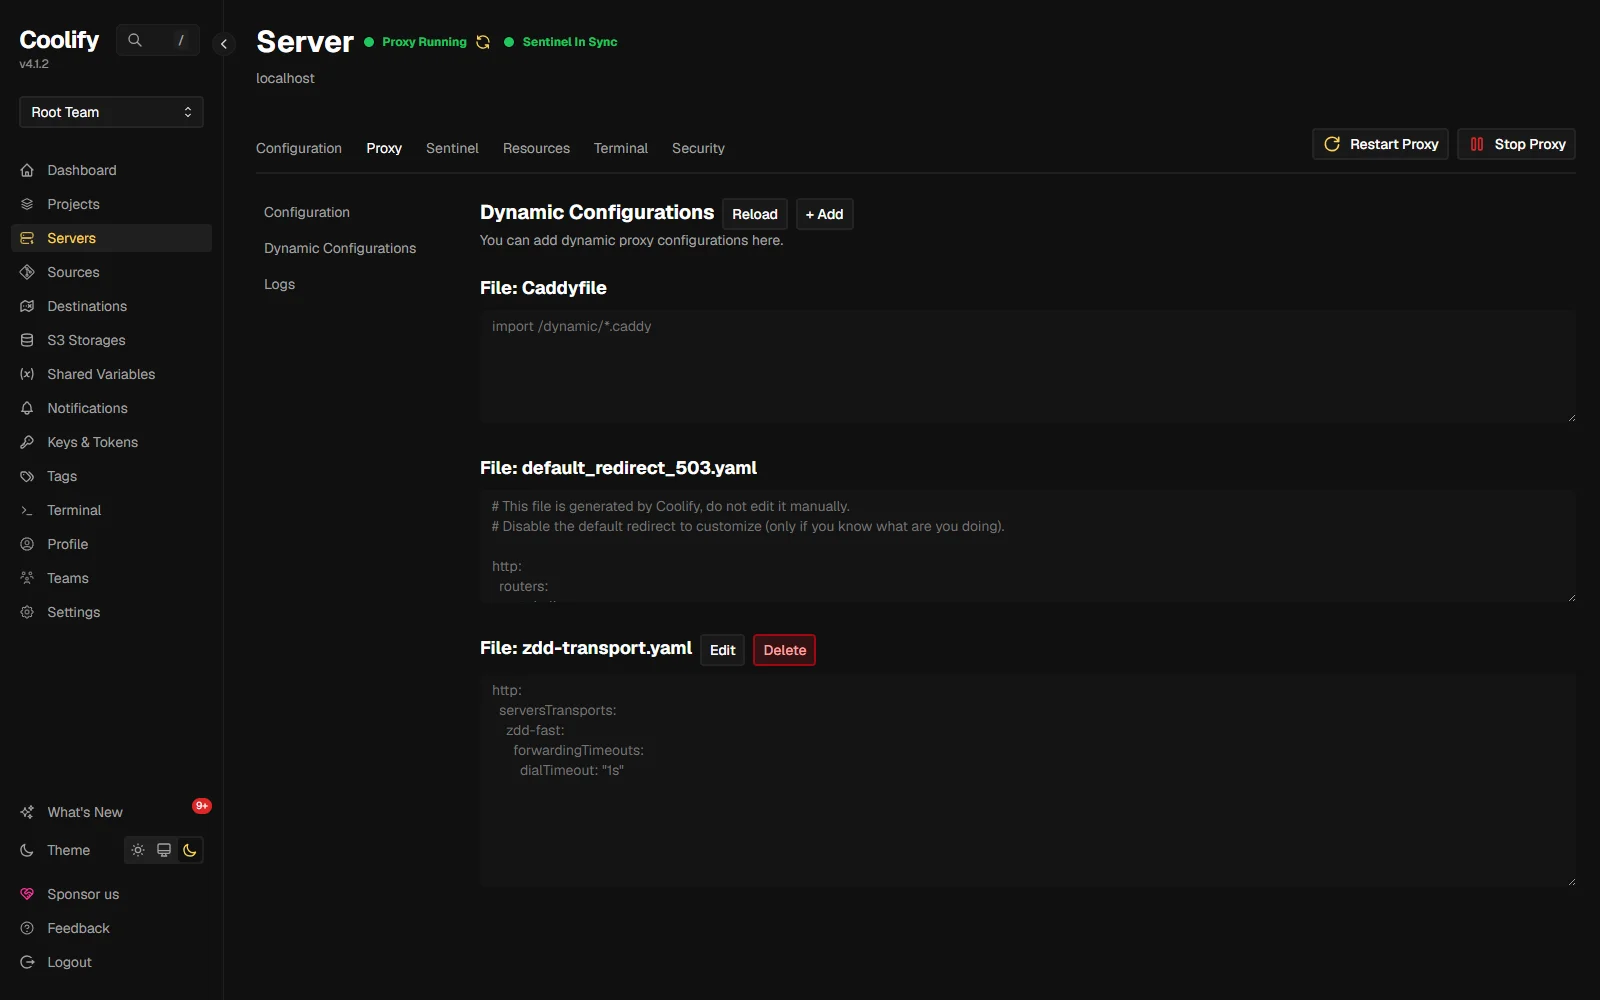
Then point the app's service at it, back in the container labels. The @file
suffix is required, it tells Traefik the transport is defined in the file provider:
traefik.http.services.https-0-<your-app-uuid>.loadbalancer.serverstransport=zdd-fast@file
With all of it in place, six deploys: 0, 0, 0.1, 0, 0, 0 seconds. Five of six deploys with zero failed requests. Across all six, one single failed request out of 3,955 probes. The one failure was a 502 that slipped through when all three retry attempts hit the dead container inside Traefik's refresh beat. I am calling that zero in the way that matters: at 10 requests per second, most deploys are now invisible from outside, and the worst case is one request.
All the numbers in one place
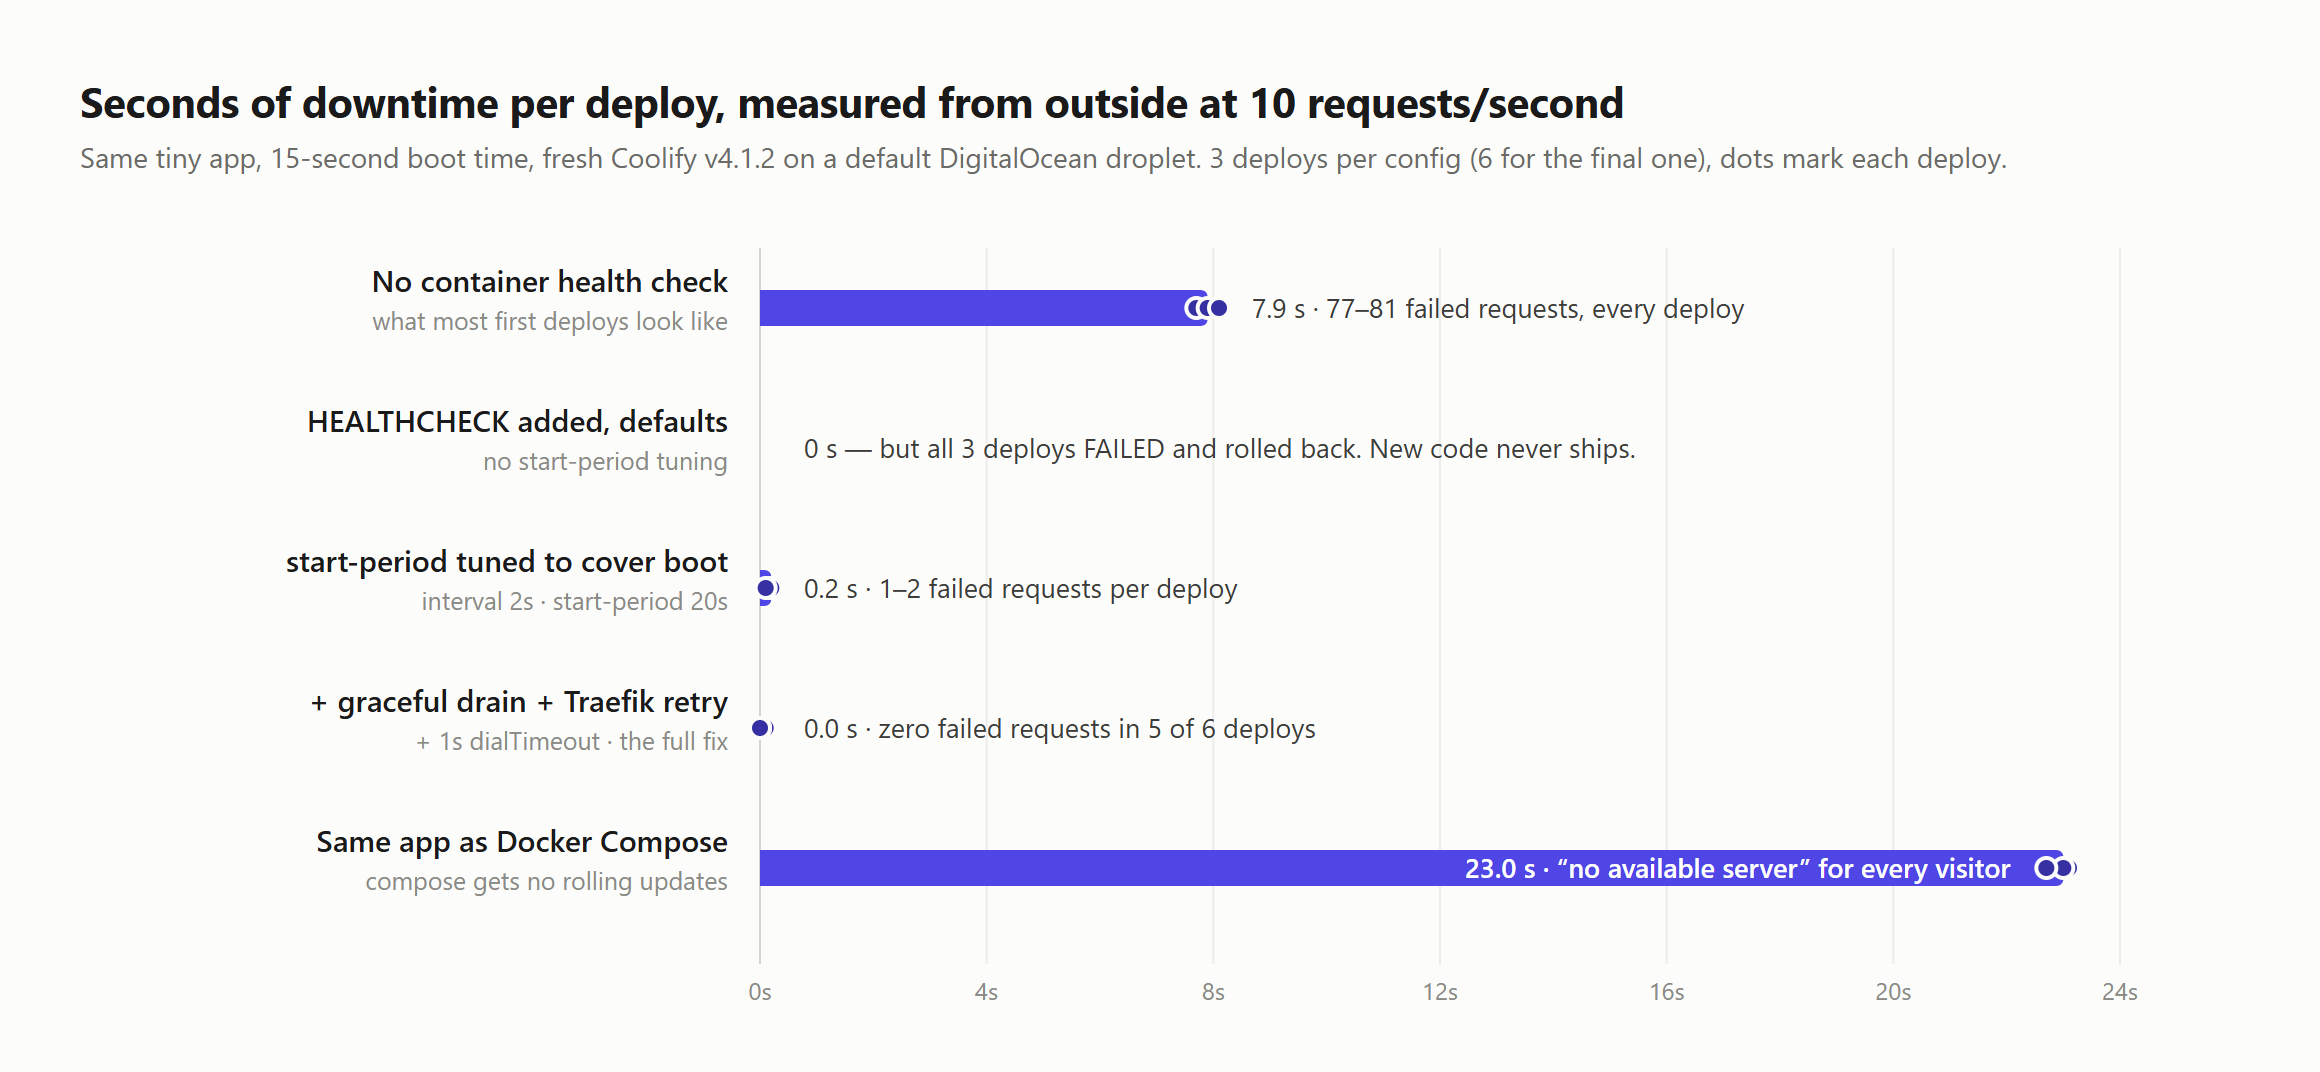
| Config | Downtime (median) | Failed requests | What actually happens |
|---|---|---|---|
| No health check Dockerfile deploy, 15s boot | 7.9 s | 77–81 | Blind rolling update. Traefik routes to the booting container; every second request 502s for the whole boot. |
| HEALTHCHECK, default timings interval 5s, retries 3, no start-period | 0 s | 0–3 | All deploys fail. Container marked unhealthy mid-boot, Coolify rolls back, old code keeps serving. |
| HEALTHCHECK, tuned interval 2s, start-period 20s | 0.2 s | 1–2 | Real rolling update. Only Traefik's table-refresh beat remains, at old-container removal. |
| + retry middleware + 1s dialTimeout the full fix, 6 deploys | 0.0 s | 1 total in 6 deploys | Zero failed requests in 5 of 6 deploys. 3,955 probes, one 502. |
| Docker Compose deploy same app, same tuned health check | 23.0 s | 207–213 | Stop-then-start. Full outage, 503 "no available server" for every request until the new container passes its health check. |
Worth saying plainly: the gap between row one and row three is the gap between "Coolify has rolling updates" being technically true and being true for your users. The feature was there the whole time. It just does nothing you can trust until the health check tells it when ready is.
The Docker Compose reality: 23 seconds
Everything above assumed a Dockerfile or image deployment. A lot of real Coolify usage is Docker Compose, including the stacks in my self-host WordPress and self-host n8n guides. So I deployed the same app as a compose resource, same tuned health check, same probe. Three deploys: 23.1, 23.0, 22.7 seconds of full outage. Not 50% errors. Everything, down, every time, with the 503 page from the top of this guide.
Starting deployment of coolify-zdd-testapp:compose to localhost.
Removing old containers.          ← old app dies here
Starting new application.
Container app-hlhc27eimw-214025 Creating
Container app-hlhc27eimw-214025 Started   ← now boots for 15s + health check
Stop first, start second. This is not a bug and not a misconfiguration. The docs say compose deployments do not get rolling updates, and the maintainers have said compose support is a v5 goal. That feature request has been open since October 2024, with 157 upvotes on the opening post and people still adding "any updates?" in 2026, which tells you how many production apps live behind this exact gap.
What I actually do about it, in order of preference:
- Deploys of YOUR app: move the web service out of compose. Keep the database, Redis and friends as a compose resource (they rarely redeploy), and run the thing you deploy daily as its own Dockerfile resource on the same Docker network, with everything this guide just configured. You change your app ten times a week. You change Postgres twice a year.
- Third-party stacks like WordPress and n8n: accept it and schedule it. You are redeploying these when you update the image, not on every code push. 23 seconds at 3 a.m. is a non-event. My container update guide covers doing that update deliberately instead of on autopilot.
- Do not bolt blue-green scripts onto compose on Coolify. I looked at the docker-rollout style workarounds the community discusses. They fight Coolify's container naming and port assumptions, and you end up maintaining a deployment system inside your deployment system. If your app genuinely cannot afford 23 seconds, it has earned its own Dockerfile resource.
If you want the deeper picture of what Traefik is doing in front of all of this, routers, services and why the proxy is the thing that decides what your visitors see, that is its own guide: what a reverse proxy actually does.
Questions people actually ask
Does Coolify support zero-downtime deployments?
Yes, for Dockerfile and image based apps, under four conditions: passing health check, default container names, no host port mapping, not compose. Out of the box with a health check it gets you to about 0.2 seconds per deploy. With the Traefik retry and dialTimeout from this guide, I measured zero failed requests in 5 of 6 deploys at 10 requests per second on Coolify 4.1.2.
Why do I still get downtime after adding a health check?
Check whether your deploys are even succeeding. With default timings, a slow-booting app is
marked unhealthy after 3 attempts and Coolify rolls back. Your site stays up on the old
container, your deploys fail, and it looks like "the health check did nothing". Set
--start-period longer than your real boot time. If deploys succeed and you still
see a blip at the moment the old container is removed, that is Traefik's refresh beat, and
step 3 is the fix.
Does zero-downtime work with Docker Compose on Coolify?
No. Measured: 23 seconds of full outage per compose deploy, same app that did 0.0 as a Dockerfile resource. The deployment log removes old containers before starting new ones, the docs say rolling updates are unsupported for compose, and compose support is promised for v5. Split your frequently-deployed service out of compose, or schedule compose redeploys for quiet hours.
Why do I sometimes see 502 Bad Gateway and other times "no available server"?
Same proxy, different emptiness. A 502 means Traefik has a container on its list and the connection to it failed: it is what you see while a new container boots, or in the beat after an old one dies. The 503 "no available server" means the list itself is empty: compose deploys produce it after removing the old container, and an unhealthy container produces it once Traefik drops it. My probe logged 76 502s interleaved with successes during one blind rolling update, and 211 consecutive 503s during one compose deploy. The status code tells you which kind of gap you have.
Is "no available server" the same error as "server is not reachable"?
No, and mixing them up sends people down the wrong rabbit hole. "No available server" is Traefik telling a visitor it has no healthy container for the domain: app-level, this guide. "Server is not reachable" is Coolify telling you its SSH connection to the machine failed: panel-level, usually after hardening SSH, and covered in the guide I wrote after breaking a server five ways.
How do I measure my own deployment downtime?
From a machine that is not the server: one request every 100 ms against your real domain, logging timestamp, status and body snippet. Deploy while it runs, count non-200 lines. My 40-line stdlib probe is in the test repo. Do not measure from the server itself, and do not trust a browser refresh: at 0.2-second windows, refreshing by hand almost always misses the gap and tells you everything is fine.
Why does the deployment log say "Rolling update started" when I have no health check?
Because the container order really is new-first. What the log does not say is that without a health check nothing waits for readiness: Traefik routes to the new container the moment it exists. The log describes the choreography, not the safety. The words to look for in a real rolling update are "Waiting for healthcheck to pass on the new container" followed by healthy.
Related
Last verified: August 12, 2026, on a fresh Coolify 4.1.2 install (Traefik v3.6.25, Docker 29.6.2) on a DigitalOcean droplet with a real domain and Let's Encrypt certificates. Every downtime number is the median of 3 measured deploys (6 for the final config), probed at 10 requests per second from a separate machine. The test app, probe script and per-deploy logs are in the coolify-zdd-testapp repo. This deployment work is one chapter of the story I teach end to end in Self Hosting 2.0: own the stack, and be able to prove it works.

Get the free Vibe Engineering Blocks guide
The exact building blocks I use to ship real products with AI — yours as a free PDF.
Questions & Discussion
Ask a question about this guide →Have a question? Ask it in the community — it's tagged #guide and linked back here. Reading is open to everyone; posting needs a free account.
Loading questions…