The Ultimate Google Analytics Revenue Tracking Guide for Solopreneurs

You’re making money online? That’s the good news.
The bad news? You probably have no clue where it’s actually coming from.
Sure, you might see some generic results, such as “Instagram brings traffic” or “SEO seems to work,” but when it comes to actual revenue data, most solopreneurs are in the dark.
Here’s what I see happening: You spend hours creating content for five different platforms, run three types of ads, send weekly emails, and optimize for SEO.
But you have zero idea which of these efforts actually puts money in your bank account.
That’s not just inefficient—it’s business suicide.
Today, we’re fixing that. I’ll show you exactly how to use Google Analytics to track every dollar back to its source, so you can double down on what works and kill what doesn’t.

The Revenue Blind Spot That’s Killing Your Growth
Most solopreneurs focus on general metrics, including page views, social media followers, and email open rates. But none of that pays your bills.
Revenue attribution is different. It answers the million-dollar question:
“What actions directly led to someone giving me money?”
Without this data, you’re basically guessing and hoping something sticks, like:
- Posting on Instagram because “everyone says you should”
- Running Google Ads without knowing if they’re profitable
- Creating SEO content that might bring $0 in revenue
- Spending time on platforms that feel busy but don’t convert
The solution? Stop tracking everything and start tracking what matters.
What Does GA4 Actually Show You
Google Analytics 4 can track revenue from multiple angles, giving you a complete picture of your money flow:
Revenue Sources You Can Track:
- Direct revenue: People who typed your URL directly
- Organic search revenue: Money from Google, Bing, etc.
- Social media revenue: Which platforms actually convert
- Email revenue: ROI from your newsletter efforts
- Paid advertising revenue: Exact ROI from ad campaigns
- Referral revenue: Income from partnerships and mentions
- Affiliate revenue: Commission-based income tracking
Here’s an example of a traffic-source revenue split:

Geographic & Demographic Revenue Insights:
- Which countries/regions spend the most
- Regions of your highest-value customers
- Which ages are paying you the most
- What genders are actually more interested in your product/service
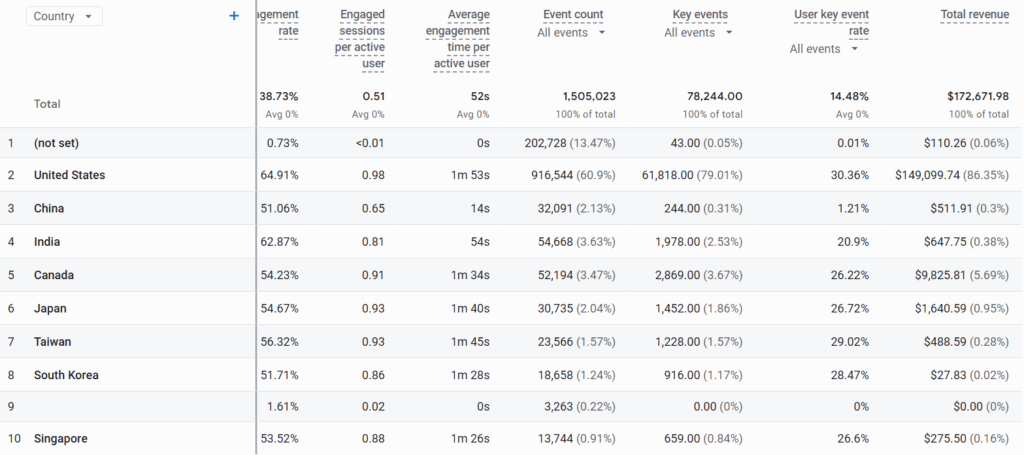
Here’s an example of a geographic revenue split:
Which Key Metrics Actually Matter
Here are the exact GA4 reports you need to check and what they’ll tell you about your money flow:
1. Where Your Money Is Coming From
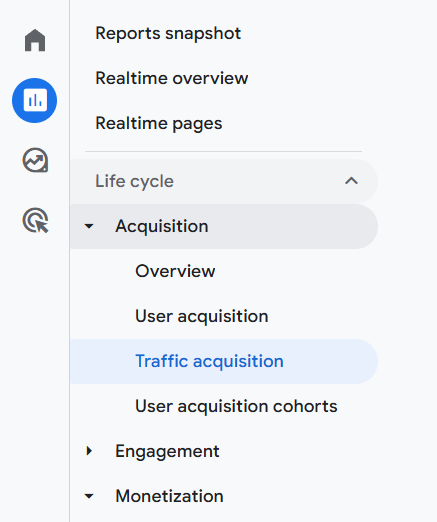
Navigate to Reports > Acquisition > Traffic acquisition
Then scroll down and swipe in the table to see the “total revenue” metric for each source.
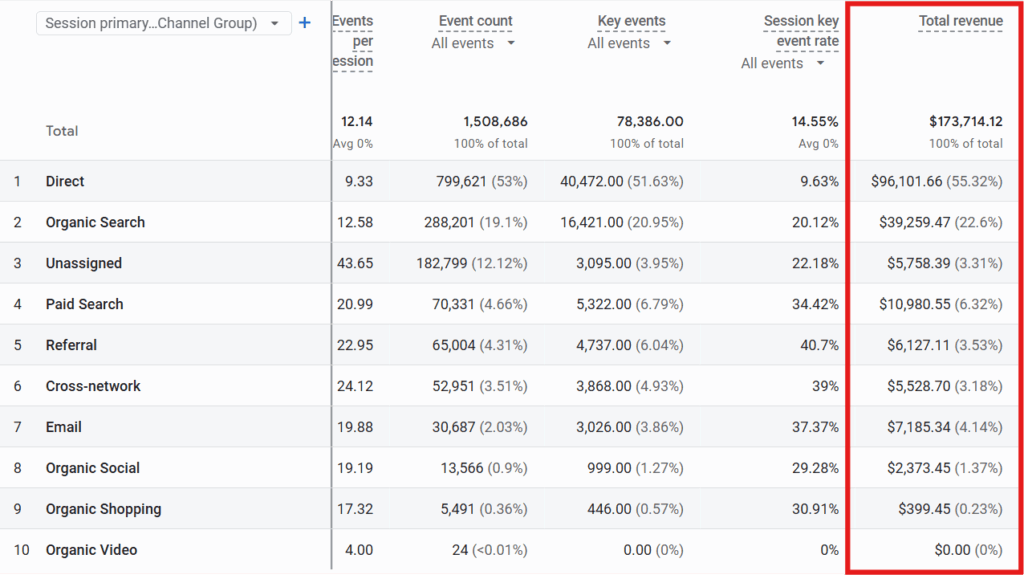
As you can see, it shows a table including:
- Session source/medium (like Google/organic, social, direct)
- Total revenue for each source
- Sessions (how many visits)
Look at the “Total revenue” column. This shows you how much money each platform is actually generating for you.
Turn Insights to Revenue
- Calculate time spent on each channel
- Reallocate 50% more time to your top 2 revenue sources
- Cut time spent on channels with below-average ROI
- Track the revenue impact over 30 days
If email drives 30% of revenue but you spend only 5% of your time there, you’re leaving money on the table.
In addition, you can calculate the revenue per session for each source manually (Total Revenue ÷ Sessions) to find your highest-converting channels and focus on them while cutting off the others.
2. Which Countries Pay You the Most
Navigate to Reports > User Attributes > Demographics

And as we did above, scroll down, and swipe in the table to the right to see the “total revenue” metric for each source.
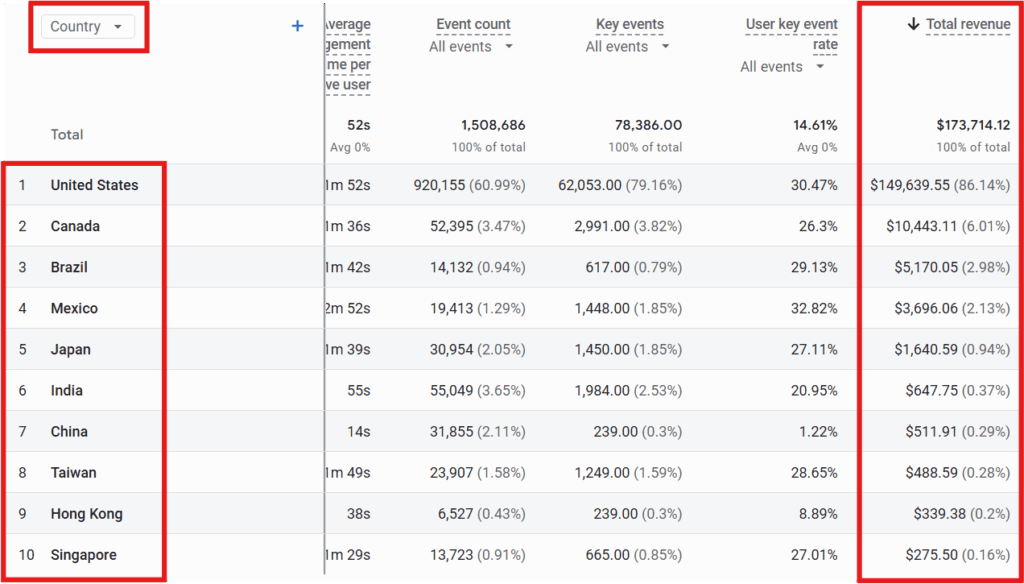
As you can see, this table shows:
- Country names
- Total revenue from each country – Which countries bring you the most money overall
- User key event rate (what percentage of visitors from each country actually buy) – Which countries have the highest conversion rates
Turn Insights to Revenue
- Identify your top 3 countries by revenue
- Create location-specific landing pages
- Adjust content timing for those time zones
- Research local payment preferences and implement them
If Brazilian users spend twice as much per purchase, create Brazil-focused content and payment options.
3. Mobile vs Desktop Revenue Check
Navigate to Reports > Tech > Tech Details, scroll down to the table and choose Device Category as a filter.

In this section, you can check:
- Desktop revenue vs Mobile revenue
- Conversion rates for each device type
Turn Insights to Revenue
If your mobile brings lots of traffic (sessions) but little revenue, your mobile checkout might be broken, or the responsiveness of your website on the mobile might be bad, leaving you with a bad user experience and high bounce rates.
So, make sure to always test your website on multiple device types to ensure it’s working properly, and avoid missing out on any potential customers.
4. Conversion Paths That Matter
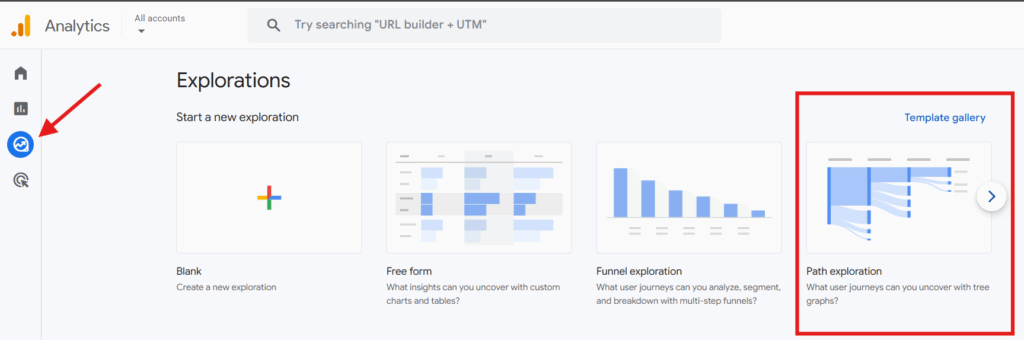
Navigate to Explore > Path exploration:
Then, edit the last step and set it to begin_checkout as your ending point of a user session, like this:
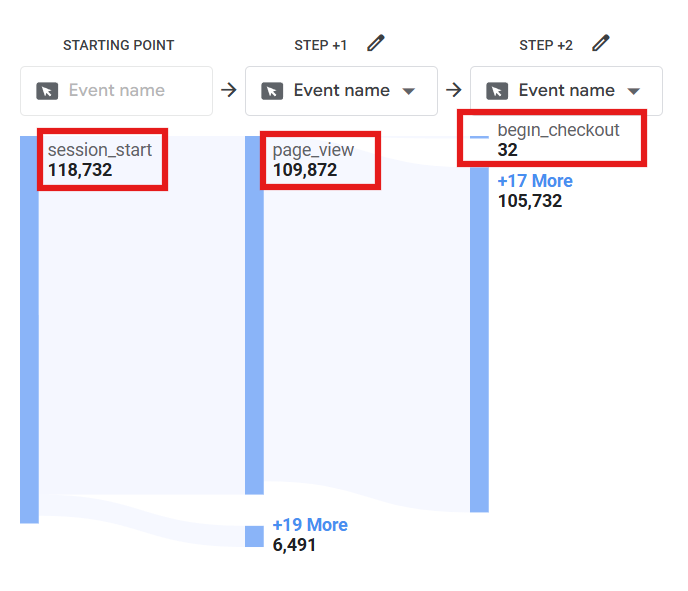
In this section, you can see:
- The typical journey from first click to purchase – You can customize it as much as you want, this is just a simple 3-step journey
- How many touchpoints do customers need before buying; you’ll need to add more steps between checkout and page view to see exactly which touchpoints users take.
- Which pages are essential in your sales process; you can do this by changing the event name to page title and screen name, and see which pages are mostly visited by your customers. Here’s what it will look like then:
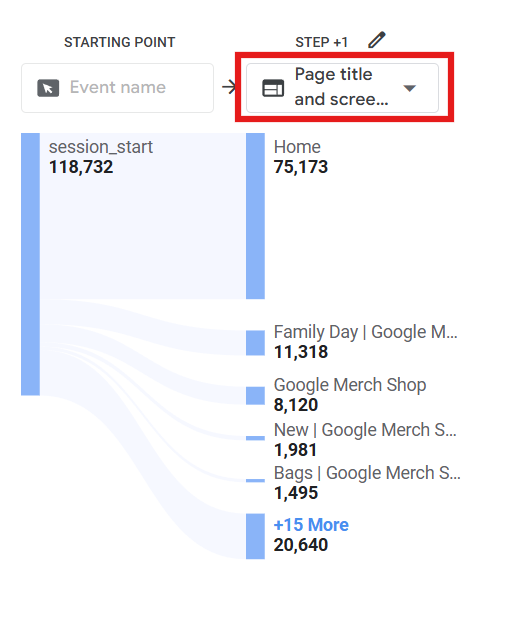
Most customers don’t make a purchase on their first visit. Understanding their journey helps you create content for each step and remove touchpoints that might be costing you sales.
Turn Insights to Revenue
- Map your top 3 conversion paths from GA4
- Identify the longest successful customer journeys
- Create direct links to purchase on each step
- A/B test new shortened funnels vs. your current process
If most customers visit five pages before making a purchase, create a direct link option that directs users directly from page 1 to checkout. Implement the same approach on all four other pages if applicable.
In addition, you can look for the most common paths to purchase. If most people visit your homepage → product page → checkout, make sure each step guides them smoothly to the next one.
5. Campaign Revenue Tracking (If You Use UTM – and you should- Links or Google Ads
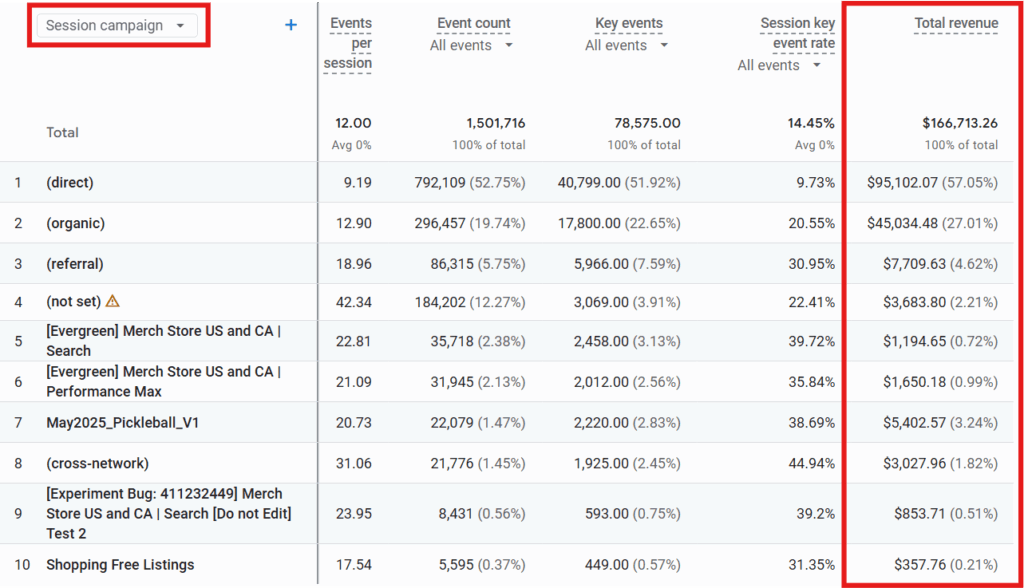
Navigate to Reports > Acquisition > Traffic acquisition, then click on the dropdown to choose Session campaign.
You’ll benefit from this section only when using:
- UTM-tagged links (links with special tracking codes like ?utm_campaign=summer_sale)
- Google Ads campaigns
- Email campaigns with proper tracking
If you’re not using UTM tracking, this report will be mostly empty or display (direct), (organic), (not set), etc… as you see above.
In this section, you can check:
- Total revenue from each specific campaign you’ve tagged
- Which email campaigns actually drive sales (if you use UTM links in emails)
- ROI of your Google Ads campaigns
If you see campaigns with high spending but low revenue, those are money drains. But if you’re not using campaign tracking yet, focus on the traffic source report instead.
Find Hidden Patterns With AI
Instead of staring at numbers and guessing what they mean, let AI analyze your traffic source data to uncover hidden revenue patterns and tell you exactly where to focus your efforts.
Step 1: Export Your Traffic Source Data
- Go to Reports > Acquisition > Traffic acquisition in GA4
- Set the date range to the last 90 days
- Click the Share this Report button (top right) and download as CSV
- You need these columns: Source/Medium, Sessions, Total Revenue (these should be set by default)
Step 2: The Revenue Analysis Prompt
Copy this entire prompt into ChatGPT and replace the bracketed sections with your actual data, and attach the CSV file:
##INSTRUCTION
You are a revenue optimization consultant analyzing traffic source performance for a solopreneur. I need actionable insights to maximize my revenue growth as a beginner. Make sure you use the attached csv which contains my GA4 traffic source data for the last 90 days, and the below inputs to gain more context about my case. Plus, it's important to:
- Be specific with numbers and percentages
- Focus on what helps with taking action, not just theory.
- Focus on what drives sales, not just the numbers that look good.

##INPUTS
- Business: [Describe what you sell in 1-2 sentences]
- Current monthly revenue: [Your approximate monthly revenue]
- Time invested per week: [How many hours you work on marketing/content]
- Main goal: [Increase revenue/find new opportunities/optimize existing channels]

##OUTPUT FORMAT
Provide the analysis in this exact format:

1. Revenue Efficiency Ranking:
   - Rank my traffic sources by revenue per session (calculate this for me)
   - Highlight the top 3 most efficient revenue sources
   - Flag any sources with low conversion

2. Time Allocation:
   - Based on revenue performance, estimate what % of my time should go to each top source
   - Identify potential time allocation mistakes I might be making
   - Suggest specific reallocation strategy

3. Hidden Opportunities
   - Spot traffic sources with low volume but high conversion rates
   - Identify potential scaling opportunities
   - Flag underperformers I should consider cutting

4. Actionable 30-Day Plan
   - Give me 3 specific actions to take this month
   - Include exact time reallocation recommendations
   - Suggest experiments to test the imporvements suggested

5. Warnings and Problems
   - Point out any concerning patterns
   - Highlight revenue sources that might be unsustainable
   - Warn about over-dependence on single channels
Step 3: How to Use the AI Analysis
Once you do it, the AI analysis will include:
- Revenue per session calculations (so you don’t have to do math)
- Time reallocation recommendations (spend 60% on X, 30% on Y, 10% on Z)
- Specific action items (not vague advice like “improve SEO”)
- Warning flags about revenue dependencies or declining sources
Here are examples of case-specific advice you might get:
- Your Instagram has 0.8% conversion while LinkedIn has 4.2% – reallocate 20 hours/month from Instagram to LinkedIn
- Direct traffic brings $45 per session vs Google’s $12 – focus on building brand awareness to increase direct visits
- Your email campaigns convert at $67 per session – this should be 50% of your effort, not 10%
You might also discover surprising insights like:
- All your organic traffic converts at 0.1% – the content isn’t aligned with buyer intent
- One channel generates 95% of revenue – dangerous over-dependence
- Hidden gems with low traffic but high conversion – scaling opportunities
Step 4: Act on the Plan
- Week 1: Implement the recommendations generated by the AI
- Week 2: Reallocate time based on the revenue efficiency ranking
- Week 3: Test one hidden opportunity the AI identified
- Week 4: Measure results, feed new data back to AI, and repeat the process
Pro tip: Save this prompt template and run the analysis monthly with fresh data. Your revenue patterns change, and AI might spot details you’d miss.
What This Actually Means for Your Business
Here’s the truth: Most solopreneurs are shocked when they see their actual revenue data.
You’ll always find some content that isn’t working like you thought it would, for example:
- The “successful” Instagram strategy that drives tons of traffic but zero sales
- The tiny email list that converts better than a massive social following
- The old blog post from two years ago that still drives monthly recurring revenue
- The platform you almost ignored that brings your highest-paying customers
The difference between growing solopreneurs and struggling ones? They follow the money trail and double down on what actually works.
Want to build smarter from the start?
My Build a 1-Person Digital Business Course walks you through every step — from validating your idea to launching and tracking a real product. You’ll set up your website, create content that converts, use AI to work faster, and learn how to track revenue right from day one.
It’s built for solopreneurs who want a clear, focused path to making real money online — without hiring a team, burning out, or wasting months guessing what works.